Covid-19 Update for Sunday, September 26
Confirmed: 85 (112,249) | Recovered: 143 (106,817 total) | In treatment: -62 (1,514 total) | Died: 4 (3,918 total)
Good evening! Welcome to The Bali Beat’s daily Covid-19 summary, where we gather virus statistics from the National, Provincial & Regency governments into a single digestible update. If you find this data useful, please share it!
If you’d like to support our news gathering efforts, please consider becoming a Contributing Subscriber for just US$5 per month by clicking here. Or if you prefer to make a one-time donation - in any amount - click here.
*Notes:
All numbers are confirmed as of 12:00 Jakarta Time.
Be sure to check the disclaimer and sources listing at the bottom.
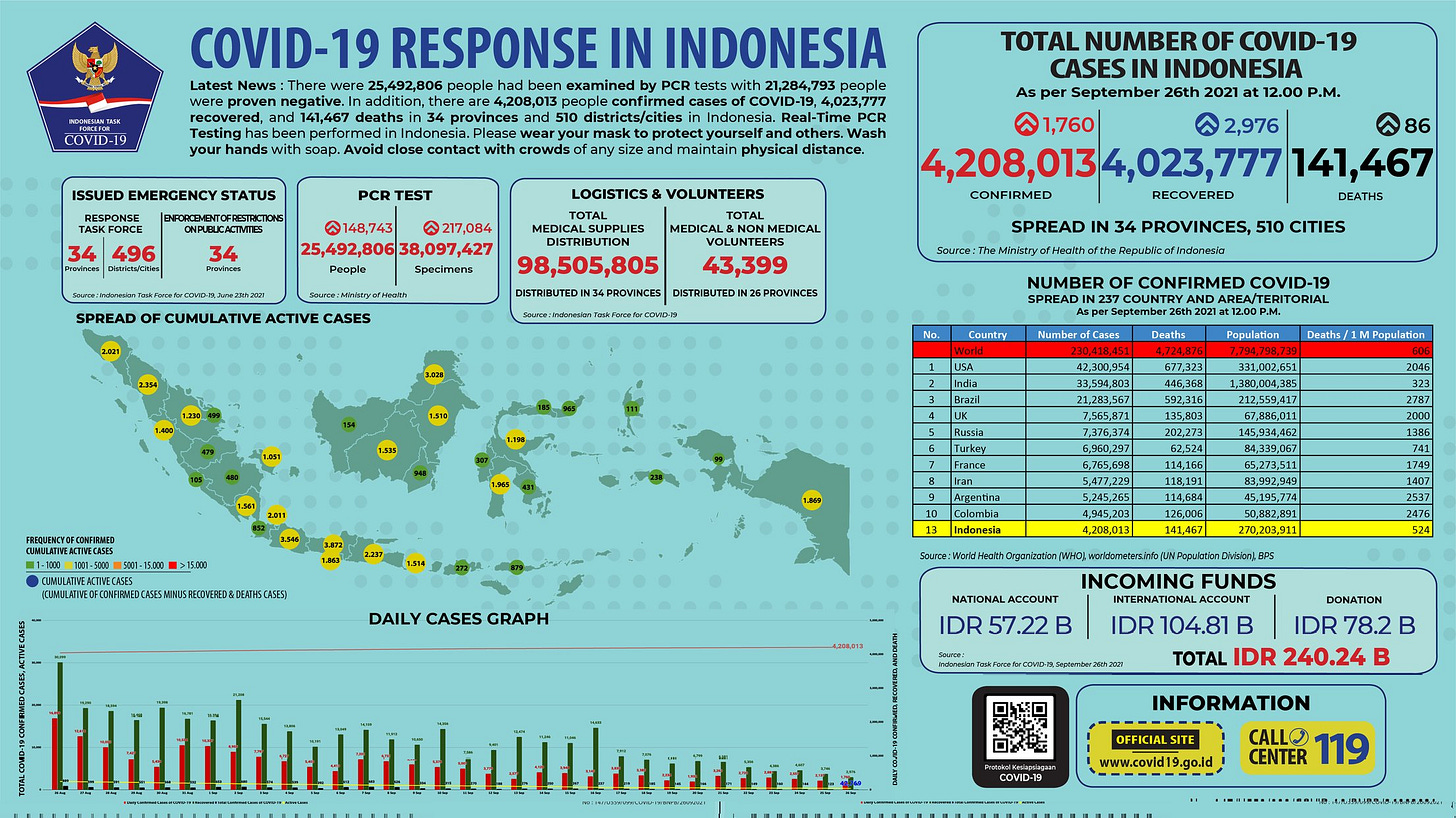
National Numbers
Bali Numbers
National Risk Assessment as of September 19
Numbers Breakdown
National Risk Map
*Note: The National Covid-19 Task Force says that the data and map are updated weekly, but we have noticed delays of up to 5 days for updates. We’ll make a note when this occurs.
The Week That Was: September 19 – September 25
Weekly Covid Trends
Weekly Covid Totals
Vaccination Numbers by Regency
*Note: When the government publishes its Vaccination Rate figures, it does so in the context of its goal of administering shots to 70% of the population. However, our Vaccination Rate reflects the number of jabs given among the total population, per the 2020 census. For example, if 700 shots have been administered in a region where the population is 1,000 people, the government will show this as a Vaccination Rate of 100%, while we will show it as 70%. See the Disclaimer below for more details.
Vaccination Trends
More info on the locations of positive cases within each Regency, as well as the number of suspected cases ("ODP") and people under in-patient observation ("PDP"), can be found in charts & infographics on the websites of each Regency's Covid-19 Task Force:
Badung | Bangli | Buleleng | Denpasar City | Gianyar | Jembrana | Karangasem | Klungkung | Tabanan
Disclaimer & Context
The data used to create the visualizations comes directly from both the national and Bali provincial governments, as listed below. Each province compiles the previous day’s numbers every morning and submits them to the national government by 12:00. As a result, you may sometimes see a discrepancy between the central government’s totals and what appears in the media, or in regency-level data. Basically, you can consider the national numbers to be “confirmed” data from yesterday, while media could be reporting on current-day figures being disclosed by government officials at regularly scheduled daily press conferences.
In terms of new cases, keep in mind that the numbers reflect confirmed cases & deaths. Tests performed on people who have died before being diagnosed may take days to return, and even after that there may be delays in reporting it in deference to the family and in order to allow funeral ceremonies to be carried out without alarming neighbors. There may also be similar delays in reporting positive test results in a timely fashion. Bottom line: All numbers are a reflection of what local governments have confirmed yesterday, not necessarily what transpired yesterday.
Some of the most important data, such as testing numbers, positivity rates, hospitalization levels, and ICU admissions, is not routinely disclosed. This makes it difficult to understand the full impact that the virus is having on the population and the island’s healthcare resources. The available data allows us to understand trends and the generalized state of the disease’s spread on Bali, but not much more.
You can read more about what kinds of Covid-19 data is most important to look for and how to understand the data that is available by reading this piece from the US public media organization, ProPublica. It’s US-centric, but the explanations are applicable anywhere.
As noted above, we display the Vaccination Rate as the percentage of shots administered among the total population, instead of the government’s practice of doing so in the context of their goal of administering shots to 70% of the population. We have made this decision for two reasons:
The WHO’s guidance on vaccination says that a 70% vaccination rate is what is required in order to drastically limit outbreaks and hospitalizations (sometimes referred to as “herd immunity”). However, the emergence of the Delta Variant has caused some epidemiologists to rethink this figure.
Displaying the Vaccination Rate as a percentage of the total population makes it easier for people to understand the program’s progress.
Sources
The national update comes from the Indonesia National Disaster Management Agency: @BNPB_Indonesia
The Bali Numbers come from the Bali Provincial Government Covid-19 Task Force (link).
The Total Confirmed Cases Distribution map & Regency Numbers figures come from the Bali Provincial Government's data collection department (link).
The National Risk Assessment Map and District figures come from the National Covid-19 Task Force (link).
Vaccination numbers come from the Ministry of Health (link).


